When investors, analysts, or curious retail traders ask about Greatland Gold share price, they are really asking several interlinked questions all at once: what is the current price, how did it get there, what business fundamentals and macro factors move that price, how does the company’s performance justify a valuation, what risks lie ahead, and what practical steps should someone take if they want to follow or invest in the stock? This article answers those questions in a single, coherent narrative written in original language and grounded in clear reasoning. It begins with a snapshot of the share price and market position, looks under the hood of the company’s recent results and the drivers that most commonly move the stock, presents practical valuation and risk frameworks with useful tables, and finishes with investor-oriented guidance and frequently asked questions. Wherever I reference time-sensitive facts—price, production figures, IPO details, or market-cap metrics—I cite official market or company sources so you can verify the numbers yourself.
Snapshot: Where the Share Price Stands Today (and why it matters)
A stock’s numeric price is only the shorthand for a deeper set of realities—company assets, future cash flows, investor expectations, and changing macro conditions—so the first useful step is a compact market snapshot. As of the latest market close noted in public market feeds, Greatland Resources / Greatland Gold (ticker GGP on the London market) has recently traded in the mid-to-high hundreds of pence per share, with a closing reference point reported at 418.00 GBX on a recent trading day and intraday ranges fluctuating in the 395–415 GBX band on that day. This pricing reflects both the company’s own operational developments and swings in commodities sentiment, particularly the gold and copper markets that underpin its asset base. For investors who rely on precise numbers, it’s important to consult live market feeds when making trading decisions because the figure above is a snapshot taken at a particular close. Google+1
Beyond the headline price, a few additional metrics give clearer context: Greatland’s shares have shown a wide 52-week range—evidence of volatility that can both reward and punish market timing—and market-cap estimates reported by several financial platforms place the company in the multi-billion-pound range (market-cap figures vary slightly across providers owing to currency conversions and timing of prints). These summary numbers help an investor see if the company is a small speculative exploration play or a large-operating miner; in Greatland’s case recent corporate moves have shifted perceptions toward a sizeable producer with significant assets, which is reflected in its larger market-cap profile relative to pure explorers. ADVFN+1
Company Overview: What Greatland Owns and Why That Moves the Stock
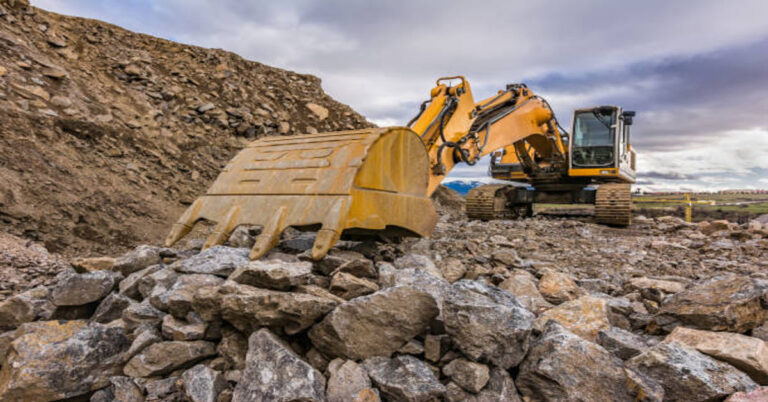
Greatland historically started as a junior exploration company but in recent years it has materially transformed through acquisitions and strategic asset consolidations that altered its asset base and cash flow profile. The most consequential corporate developments include the acquisition or integration of operating assets—large gold and copper projects in Western Australia—and moves to list or seek a secondary listing on markets such as the ASX to broaden investor access. The business now straddles a transition: from being primarily an exploration and development story to being an operating producer with revenue and quarterly production figures that investors can analyze. That transition is central to understanding share-price behavior because the market values cash flow certainty and scale very differently from optionality on a discovery. The company’s own investor disclosures and quarterly updates provide the authoritative description of this evolution. greatland.com.au+1
Why does this structural change matter? In exploration-stage companies, prices mostly reflect future hope—how likely a discovery is and whether the company will be able to commercialize it. For operating producers, prices are driven by realized production, operating costs (AISC—All-In Sustaining Cost—per ounce for gold is a common metric), commodity prices, capital expenditure requirements, and balance-sheet strength. Greatland’s more recent quarterly and full-fiscal updates emphasize production volumes, operating cash flow, and cost control, all attributes that typically reduce valuation uncertainty and can support a higher multiple if the market believes the company will sustain production and margins. Investing.com+1
Recent Operational and Financial Highlights (why investors reacted)
When a mining company shifts toward producing ounces and tonnes each quarter, investors naturally focus on production numbers, cash flow, and cost per unit. Greatland’s recent periodic reports highlight robust quarterly gold and copper production, a strong operating cash flow figure that returned into the hundreds of millions on an annualized basis, and an improved cost profile that in some reports landed below initial guidance. Those operational results, combined with strategic transactions such as the acquisition of the Telfer mine assets and the move toward an ASX presence, have been interpreted by markets as signs of a maturing business model—one that can deliver both near-term cash and optionality for longer-term resource development. These concrete results are the engine behind recent share-price moves when announcements arrive. The company’s quarterlies and corporate releases provide the detailed production and cash-flow numbers behind that narrative. Investing.com+1
It’s important to note that markets often ‘look through’ single quarters and instead react to trend changes and guidance. For example, a single quarter of higher production will help the stock if management also signals sustainable cost improvements and credible guidance for upcoming quarters. Conversely, if production beats are met by higher capital expenditures or operational issues that threaten margins, the positive price shock may be temporary. This interplay explains why investors should read production headlines in the context of management commentary, capital program plans, and balance-sheet condition.
What Actually Drives Greatland Gold’s Share Price? (factors and mechanics)
There are several interlocking variables that drive the share price of a company like Greatland; understanding each helps an investor separate transient moves from structural revaluations.
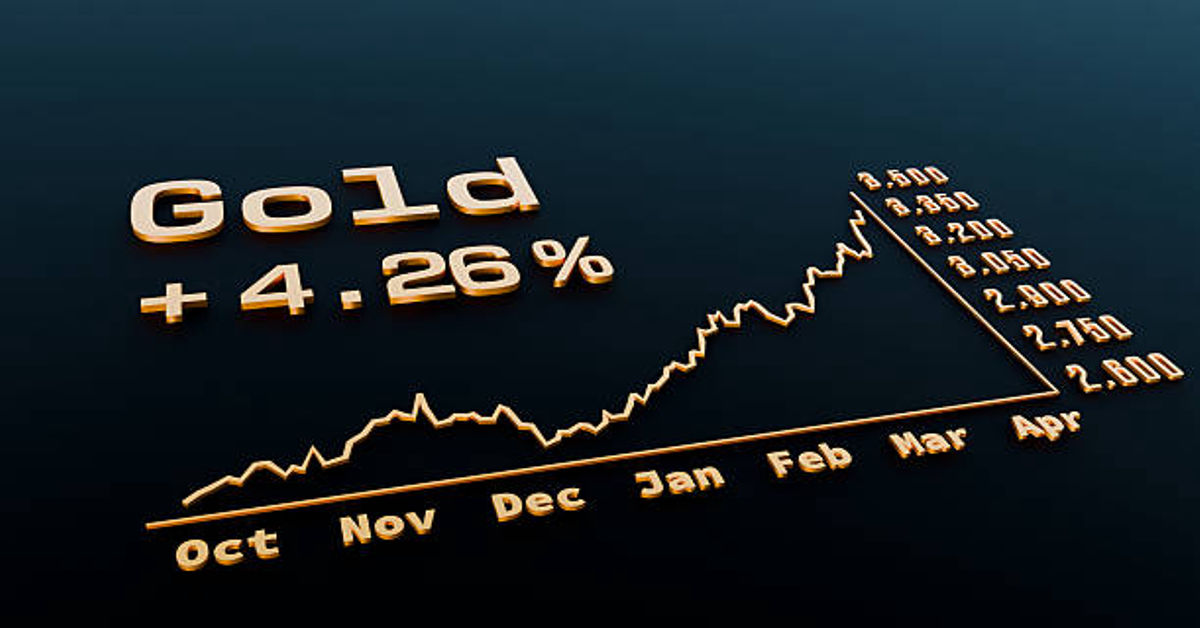
- Commodity Prices (Gold and Copper): Because Greatland’s revenue is derived from selling gold and copper, the prevailing world prices for these metals are the single most direct driver of revenue per unit. When gold rallies on macro concerns—currency weakness, rising inflation expectations, or geopolitical risk—miners typically see immediate valuation tailwinds. Copper, equally important for Greatland’s asset mix, responds to industrial demand and cyclical growth expectations (for example, construction and electrification drive copper demand). Commodity price exposure means that the share price will reflect both company-specific performance and commodity market sentiment.
- Production Volumes and Unit Costs: The number of ounces and tonnes Greatland produces each quarter, and the AISC (all-in sustaining cost) per ounce or tonne, determine operating margins. If production rises and AISC falls, margin expansion can justify higher share prices even if commodity prices are stable. Conversely, rising AISC or lower-than-expected production tends to depress the multiple investors are willing to pay.
- Balance Sheet Strength and Cash Flow: Net cash positions, debt levels, and operating cash flow change investor perceptions of risk. A cash-rich, debt-light producer is often given a premium because it can fund growth and weather commodity dips without distress financing.
- Project Development and Reserve Upgrades: Upgrades to resource estimates, successful exploration results at nearby deposits, or positive feasibility studies that expand mine life can materially increase the asset value of the stock.
- Corporate Actions and Listings: Moves such as secondary listings, strategic acquisitions, or divestments alter the shareholder base and liquidity; for example, an ASX listing increases access to Australian institutional capital, potentially supporting higher valuations reflecting deeper investor interest.
- Macro and Sentiment Factors: Interest rates, inflation expectations, equity market risk appetite, and political developments all affect risk-on/risk-off modes and therefore miner valuations. In risk-off periods, gold often rallies and miners may be re-priced upward; in risk-on markets, copper benefits and miners with industrial metals exposure may do well.
- Operational Risks and Unexpected Events: Unplanned shutdowns, regulatory issues, or cost blowouts tend to be amplified in price moves because they affect near-term cash flow and can raise doubts about management execution.
These drivers interact. For instance, a gold price surge combined with improving production and a strengthened balance sheet provides two reinforcing reasons for the market to repriced the stock upward; a commodity rally alone is less convincing if the company cannot deliver product. When evaluating the share price movement in practice, an investor should try to attribute price changes to one or more of the drivers above rather than assuming a single cause.
Valuation and Metrics: How to Read the Numbers (tables to clarify)
Valuing a mining company requires both absolute and relative metrics. Absolute metrics look at discounted cash flows from forecast production; relative metrics compare the company to peers using multiples such as EV/EBITDA, price per ounce of reserves, or market cap per annual production.
Key Market Metrics (example table — illustrative: verify with real-time data before trading)
| Metric | Example / Meaning |
|---|---|
| Current Share Price | e.g., 418.00 GBX (recent close; check live feed). Google |
| Market Capitalization | Multi-billion GBP range depending on latest share count and price; check platform reports. ADVFN |
| 52-Week Range | Wide range indicating volatility; e.g., ~102.50p to 435.00p in last 52 weeks (source dependent). ADVFN+1 |
| Production (annualized) | Hundreds of thousands of ounces of gold—company-reported figures vary by fiscal period. Investing.com |
| AISC (All-in Sustaining Cost) | Key profitability metric per ounce—recent guidance and results should be consulted from company releases. Investing.com |
| Net Cash / Debt | Critical for risk assessment—check balance sheet in the latest financial report. greatland.com.au |
These illustrative metrics help frame the financial picture. For investors seeking to do a detailed valuation, the DCF (discounted cash flow) requires production forecasts, commodity price assumptions, capital expenditure schedules, and an appropriate discount rate; many practitioners also triangulate DCF outcomes with peer multiples to sanity-check assumptions.
Historical Performance and Volatility: What the Charts Reveal
A glance at a 12-month chart for Greatland typically shows large oscillations that coincide with commodity price swings, corporate announcements, and significant market re-rating events such as asset acquisitions or listing moves. The 52-week band for the stock has been wide—evidence of high beta relative to broader indices. This pattern is typical of mining stocks transitioning from exploration to production: the market sometimes overreacts to short-term operational hiccups while rewarding sustained execution over time. For practical purposes, a long-term investor should expect volatility and plan position sizing accordingly, while traders may seek to exploit short-term moves around news events.
When assessing historic performance, separate the noise from the signal: one-off events (for example, the announcement of a transaction or a single poor quarter) produce spikes that are often reversed; consistent trends in production growth and margin improvement are what re-rate stocks permanently. Chart-based indicators—moving averages, volume trend lines, and relative strength metrics—can help time entries and exits, but they must be combined with a fundamental view to avoid being led by purely technical signals.
SWOT Analysis: Concise Strategic View (table)
| Strengths | Weaknesses | Opportunities | Threats |
|---|---|---|---|
| Large, quality assets with production capacity | Exposure to commodity price swings; AISC sensitivity | Reserve upgrades, regional exploration upside, ASX listing broadening investor base | Regulatory changes, operational disruptions, metals price declines |
| Recent operational scale provides revenue visibility | Integration risk from acquisitions | Potential to reduce unit costs via optimization | Cost inflation, supply chain challenges, environmental constraints |
| Improving cash flow and balance-sheet flexibility | Historical volatility deters some investors | Strategic M&A or diversification into higher-margin products | Political or permitting risk affecting mining operations |
A SWOT table is a compact way of capturing the variables investors should weigh. Strengths and opportunities hint at why the company might deserve a premium; weaknesses and threats explain why the market might discount it.
Practical Guide: How to Track and Trade Greatland Shares
If you want to follow Greatland’s share price effectively, set up a workflow that combines live market feeds, company announcements, and commodity-price monitoring.
- Use Reliable Market Sources: Bookmark the London Stock Exchange stock page for GGP, Google Finance, or a broker’s real-time feed for instant price tracking. Official exchange pages also publish daily trade recaps with volume and price ranges. London Stock Exchange+1
- Monitor Company Releases: Sign up for email alerts or RSS feeds from Greatland’s investor relations page and the regulatory news services (RNS/ASX announcements). Quarterly production updates, guidance changes, and capital-expenditure plans are the most price-sensitive releases. greatland.com.au
- Watch Commodity Markets: Follow gold and copper spot prices, futures curves, and market commentary. Movements in these markets often precede and amplify company-specific moves.
- Follow Analyst Notes and Broker Research: While always taken with a grain of salt, analyst notes can provide valuation frameworks and consensus estimates that help you understand how institutional investors are positioning. Note that broker coverage varies by company and jurisdiction.
- Set Alerts and Risk Controls: Use limit orders, stop-losses, or position-size rules to manage downside risk. Mining stocks can gap on news, so consider whether you need guaranteed stop protection if your broker offers it.
- Consider Forex Exposure: For UK-listed miners reporting in USD or AUD, investor returns also vary with GBP/USD or GBP/AUD moves if you measure performance in your domestic currency.
By combining these steps into a disciplined routine, you can respond to news and price moves more rationally and avoid common behavioral pitfalls.
Investment Considerations: Risks, Time Horizon, and Portfolio Role
Mining stocks occupy different roles depending on an investor’s horizon and risk tolerance. Here’s how to think about Greatland in portfolio terms.
- Short-term traders will focus on catalyst events—quarterly production updates, commodity rallies, or news of new resource estimates. They must be prepared for volatility and the psychological demands of active trading.
- Medium-term investors may view Greatland as a leveraged play on gold/copper prices plus production growth. For them, the key question is whether the company can sustain production and lower unit costs, converting current operational momentum into predictable cash flows.
- Long-term investors should evaluate the underlying asset base—the quality of reserves, mine life, and exploration upside—because long-term returns depend on both commodity cycles and corporate execution over many years.
Risks to weigh include commodity-price cycles, operational execution, cost inflation, permitting and regulatory environment, political risk in the jurisdictions of operation, and the potential for acquisitions or capital-intensive projects to dilute shareholder value if not managed carefully. Diversification is vital—exposing only a portion of a portfolio to single-commodity producers reduces idiosyncratic risk.
Scenario Analysis: Three Reasonable Outcomes for the Share Price
To make the abstract more concrete, consider three simplified scenarios that capture plausible paths for the share price:
- Bull Case (Execution + Bull Commodity Market): Production increases, AISC falls, commodity prices (gold and copper) stay elevated or rise. Market rewards stable cash flows and growth, rerating the company to higher multiples and pushing the share price materially above recent highs. This outcome typically requires both company execution and favorable commodity momentum.
- Base Case (Steady Operations, Mixed Commodity Signals): The company meets guidance, maintains margins, and commodity prices are stable to mildly positive. Share price tracks broader resource indices, with moderate appreciation tied mainly to steady earnings and incremental reserve upgrades.
- Bear Case (Operational Issues / Commodity Downturn): Production shortfalls, rising costs, or a sharp commodity-price drop erode margins; investors re-price risk, and the share trades significantly down. Market confidence can take time to restore, and the company may need to make strategic changes to regain momentum.
These scenarios show why investors should think in probabilities and assign position sizes according to the scenario they find most likely and their own risk tolerance.
Practical Valuation Tip: Price per Ounce and EV/Production
A simple mining valuation heuristic compares the company’s enterprise value (EV) to annual production or to proven and probable reserves (price per ounce). While crude, these ratios offer a quick cross-check against peers: if Greatland’s EV per annual ounce is significantly higher than peers with similar cost structures and growth potential, the market may already be pricing in superior growth or lower risk; if it’s lower, the market either sees higher risks or undervaluation. For precise answers, calculate EV using the latest market-cap plus net debt, then divide by annual production or reserve ounces. Always ensure you are using consistent units and up-to-date numbers from company reports.
Conclusion
Greatland’s share price is a live barometer of three things at once: the market’s view of the underlying asset base, the short-term operational execution that turns reserves into revenue, and the macroeconomic environment that sets commodity prices. Recent corporate steps—asset integration, production increases, and strategic listing activity—have moved the company toward a profile more commonly associated with established producers, and that shift is reflected in market-cap and price behavior. However, mining remains cyclic and operationally intensive: investors should expect volatility, read production and cost metrics carefully, and balance commodity exposure with company-specific fundamentals.
For those interested in either trading or investing, the practical steps are simple but disciplined: rely on live market data for pricing, follow the company’s regulatory filings for production and guidance, monitor metal prices closely, and size positions according to your risk tolerance and time horizon. When in doubt, use clear metrics—AISC, production volumes, net cash/debt, and EV per production ounce—to anchor your valuation and make decisions with information rather than emotion.
Five Frequently Asked Questions (FAQs)
1. What is Greatland Gold’s current share price and where can I verify it?
The company’s latest closing prices and intraday ranges are available on live market platforms such as the London Stock Exchange, Google Finance, and broker trading terminals; a recent reference close reported at 418.00 GBX is an example snapshot—always confirm with live sources before trading. London Stock Exchange+1
2. What are the most important company numbers to watch for future price moves?
Monitor quarterly production volumes (ounces of gold, tonnes of copper), the AISC per ounce metric, operating cash flow, and net cash/debt. Changes in any of these metrics typically have direct and immediate pricing consequences. Investing.com+1
3. How does gold and copper pricing affect Greatland’s valuation?
Gold and copper spot and futures prices determine revenue per unit sold; higher metal prices increase operating margins and free cash flow, which in turn support higher valuation multiples. Copper exposure adds growth leverage tied to industrial cycles, while gold often provides defensive uplift during macro uncertainty.
4. Is Greatland a speculative or a stable investment?
Greatland sits somewhere between pure speculation and stable production exposure: it has transitioned into a producing asset base that offers revenue visibility, yet it still carries mining-sector cyclicality and operational risks. The stock is therefore best viewed as a commodity-linked equity requiring active monitoring.
5. Where can I find company updates and official filings?
Official investor relations pages, exchange regulatory news services (RNS on the LSE, ASX announcements if applicable), and the company’s quarterly and annual reports are the primary authoritative sources for production data, guidance, and financial statements. greatland.com.au+1